
Sania Fathima
MBA
“The course provided useful knowledge and insights related to the subject. The content was informative and relevant, and it helped me gain a better understanding of the concepts covered.”
SKILLS: Data Preparation | Visualization | Data Communication
This course introduces the fundamental concepts and techniques of data visualization using Python. It covers the complete visualization pipeline, including data acquisition, preprocessing, and transformation using Pandas, and the creation of effective visualizations using Matplotlib and Seaborn. Students will learn to analyze statistical and time-series data, interpret visual patterns, and communicate insights through meaningful graphical representations. The course emphasizes hands-on learning with real-world datasets, including financial data from YFinance, and culminates in a capstone project that integrates data collection, cleaning, visualization, and insight generation for data-driven decision-making.
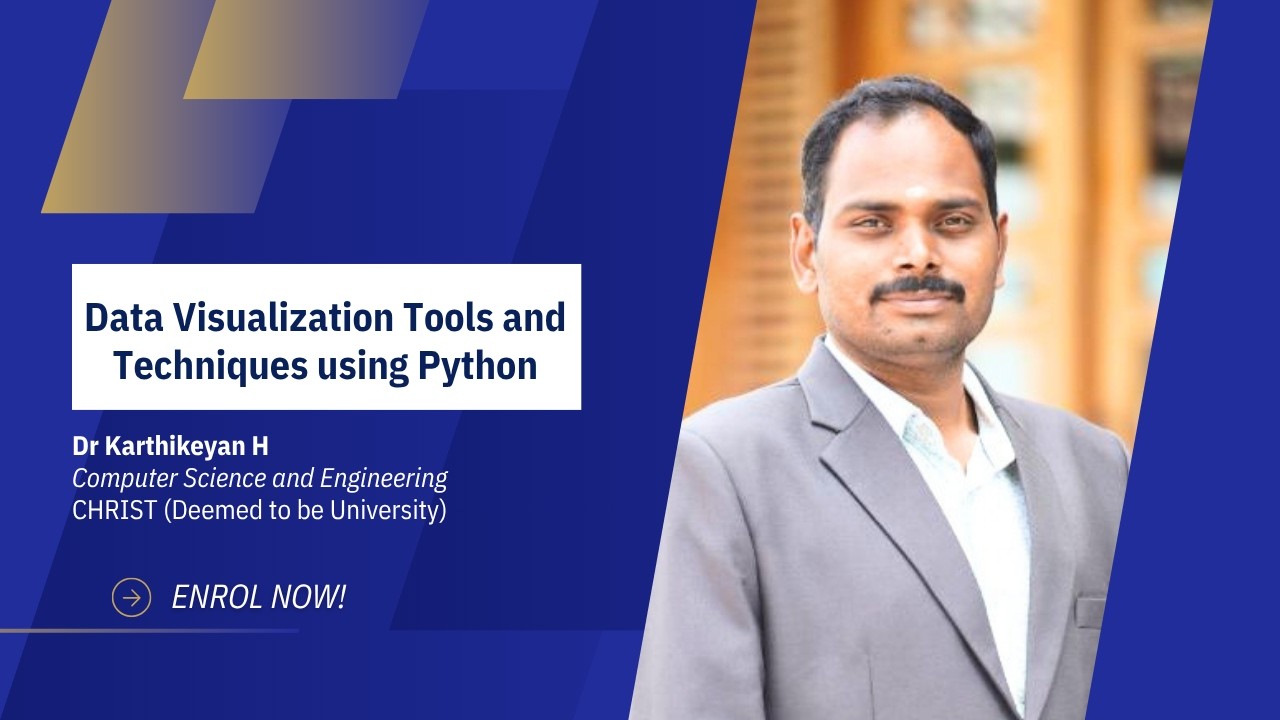
Our curriculum matches modern standard practices to provide exceptional training milestones.
Our curriculum matches modern standard practices to provide exceptional training milestones.
Basic knowledge of computer operations and programming concepts. Familiarity with Python programming fundamentals (variables, data types, loops, functions, and libraries). Understanding of basic statistics and data handling concepts is desirable but not mandatory. Suitable for undergraduate students in Computer Science, Information Technology, Data Science, Artificial Intelligence, Electronics, and other engineering disciplines, as well as beginners interested in data visualization and analytics.

Expert guidance from acclaimed industry professional leaders.

A meticulous, guided learning path engineered to transform your cloud engineering expertise.
Introduction to Data Visualization, Importance of Data Visualization, Types of Data and Charts, Visualization in the Data Science Lifecycle, Chart Selection Based on Data Types, Exploring Datasets for Visualization.
Introduction to Python Libraries for Visualization (NumPy, Pandas, Matplotlib, Seaborn), Pandas DataFrames for Visualization, Importing Data from Various Formats (CSV, Excel, JSON, APIs), Data Exploration and Inspection, Working with Financial Data using YFinance.
Data Cleaning Concepts, Handling Missing Data, Handling Duplicate Data, Data Transformation and Feature Extraction, GroupBy Operations and Aggregation Techniques, Data Preparation and Preprocessing for Visualization.
Introduction to Matplotlib, Line Charts, Bar Charts, Histograms, Scatter Plots, Chart Customization (Titles, Labels, Legends, Colors, Grids, Annotations), Best Practices for Effective Visualization and Chart Readability, Creating and Customizing Visualizations using Matplotlib.
Introduction to Seaborn, Distribution Plots, Categorical Plots, Box Plots and Violin Plots, Heatmaps, Pair Plots, Time-Series Visualization Basics, Moving Averages and Trend Analysis (20-Day and 50-Day Moving Averages), Interpretation of Statistical Charts and Visual Patterns, Creating Statistical and Time-Series Visualizations using Seaborn.
Capstone Project Planning and Problem Identification, Dataset Selection and Preparation, Data Cleaning and Exploratory Analysis, Visualization Design and Dashboard Development, Data Interpretation and Insight Generation, Project Documentation and Report Preparation, Final Project Presentation, Demonstration, Submission and Evaluation.
Hear from CUx learners about their experiences, practical learning, and discoveries beyond the classroom.
MBA
“The course provided useful knowledge and insights related to the subject. The content was informative and relevant, and it helped me gain a better understanding of the concepts covered.”

MBA
“I thoroughly enjoyed the Micro Credential course. It was direct and very informative.”

MBA
“The modules were structured in a simple and accessible way, making the concepts easy to understand even without prior knowledge of the topic. The workbooks provided valuable hands-on practice, and the course was an enriching learning experience that helped me build practical skills and confidence.”

MCA
“The hands-on demonstrations and coding sessions were my favourite part. Overall, it was a valuable learning experience that helped me learn beyond the classroom, explore a new area, and become more curious about what AI can do.”

BCom
“It was interesting to learn about a new topic which was predominant in the world. The videos were short and kept me engaged throughout the course.”